Cricket match predictions, explained in plain language
The prediction desk runs on five signals, not gut feel.
Come Sports Match publishes a single prediction per fixture: a probability that one side wins. We don’t publish binary win-or-lose calls, we publish a number, the reasoning behind it, and the five signals that go into the calculation. The five signals are pitch, weather, head-to-head, recent form and the toss, weighted differently for every format. Predictions go live three hours before the toss, and the desk updates them once the toss has happened and the dew forecast has firmed up.
On Test match days, the desk runs a different model. A Test result is shaped by how the pitch changes between day one and day five, who has the deeper batting, and which side has the better spin option in the fourth innings. The desk does not pick a Test winner until lunch on day one.
The desk does not publish a probability for any fixture in formats where the signal-to-noise ratio is too low — that’s most T20 franchise cricket after the auction, where player movement and last-minute replacements break the model. For those fixtures, we publish the factors to watch and a recent-form summary, and we do not pretend a number is meaningful when it isn’t.
What the prediction model is actually weighing.
Pitch
Surface type, grass cover, moisture, and a curator’s quote if we can get it. A dry fifth-day wicket in Chennai shifts a Test probability by ten points; a green seamer in Wellington does the same in the other direction.
Weather
Dew forecasts, rain probability, wind direction and a heat index for the players. The desk uses local meteorological data, not global feeds. A dew window in Mohali at 7 pm is worth six to eight runs to the chasing side.
Head-to-head
All meetings between the two sides in the last five years, broken down by venue and format. Sample size matters — the desk refuses to lean on fewer than five matches before publishing a head-to-head number.
Recent form
Last five matches in this format, weighted toward home conditions. The W/L record matters less than the chasing rate when the side last batted second.
Toss impact
Format-specific: small in Tests, large in day-night ODIs, very large in T20 franchise cricket. The desk treats the toss impact as probabilistic, not deterministic.
Captain’s tactical template
Field settings in the powerplay, bowling rotation, batting order, and the % of occasions the captain chases vs defends when winning the toss. A captain’s history is more predictive than the team-sheet.
Pitch and conditions
A pitch read is built from three things: grass cover (length and density), moisture (can you hear it squeak under the boot?), and the curator’s habit. The desk maintains a per-venue profile for every international ground, and updates it after every completed match — because a curator who rolled a surface in October is not necessarily the same curator in February.
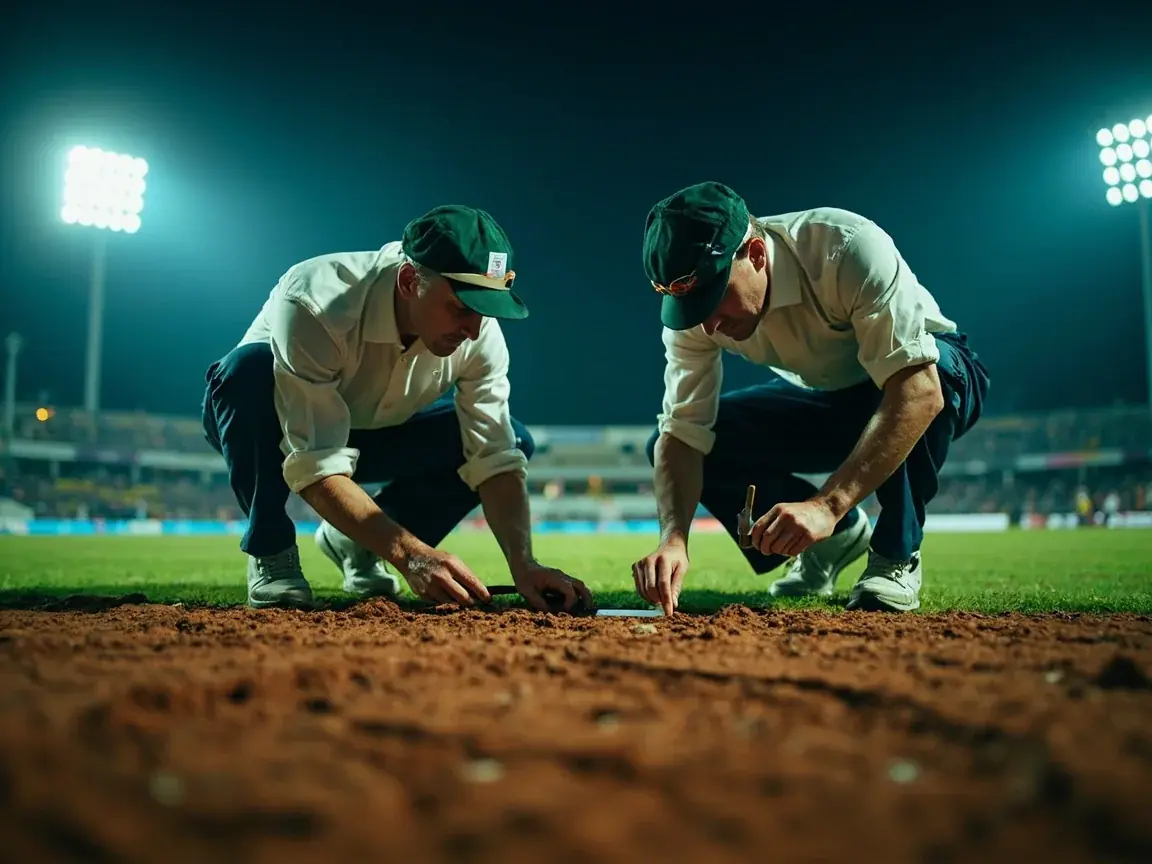
The 1st ODI at Bready, with the predicted XIs and the toss call.
How the desk calls the XI.
For every international fixture the desk publishes a probable XI based on the last six selections, the player’s recent form, the surface, and the captain’s known tactical template. The probable XI is updated twice: once when the host broadcaster publishes the squad, and once when the team management releases the team sheet at the toss.
The probable XI does not try to be clever. If a fast bowler rotated out of the last ODI is back in the squad for this one, the desk says so. If the captain has named an unchanged XI in three of his last four matches, the desk respects that and does not try to chase a phantom change.
Selection-evidence: putting the probable XI on the record
The probable XI is the part of the prediction that earns its salt. It’s the only prediction the desk publishes that can be verified within an hour — either it matches the team sheet or it doesn’t, and we record the record publicly on the verification page.
Continue readingWhy the toss matters more in some formats than others.
Test cricket
The toss impact is small. A Test win depends on how the pitch breaks down between days one and five, and the side batting last usually wins only if the pitch is turning or the target is below 150. The desk adjusts the probability by 5–8 percentage points after a Test toss.
ODI cricket
The toss impact is large in day-night matches, where the chasing side picks up six to eight runs from the dew window. In day ODIs the toss is closer to a 50–50 call unless the surface is dry and abrasive.
T20I & franchise T20
The toss impact is large. Chasing sides win 56–58% of completed T20Is when the dew sets in, and 47–49% when it doesn’t. The desk uses the local dew forecast — not the generic “evening” verdict — to call it.
Day matches
Day ODIs and day T20s reverse the dew logic. The captain who wins the toss will bat first — and the desk treats that as a 51–53% probability shift in favour of whichever side batted first.
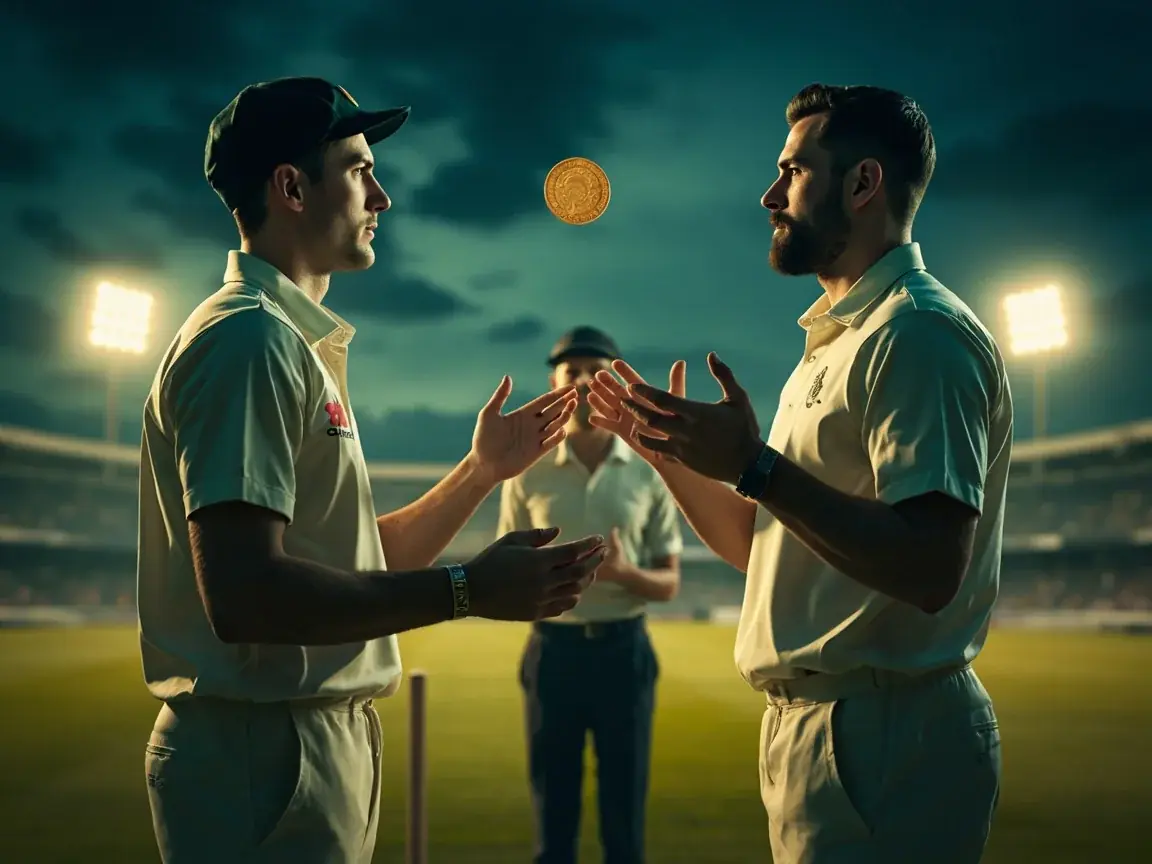
When the coin doesn’t fall your way
A side that loses the toss can still win — and the desk has published the percentage on which side wins more often than the toss for every major venue. At Lord’s in a day Test, the side that lost the toss and was asked to bowl last went on to win 41% of completed matches in the last decade. The desk’s record page runs the number, the sample, and the source.
Prediction desk questions, answered.
When does the prediction go live?
Three hours before the toss for limited-overs matches. Lunch on day one for Tests. We’ll publish a “factors to watch” note earlier if the model says the signal is too weak.
What does the probability mean?
It’s the chance that team A wins, all else equal. A 60% number means the model thinks team A wins six matches out of ten with the same conditions and inputs.
Do you publish a prediction for the IPL?
Yes, for every league match. Predictions for knockout matches go live once we have the confirmed XI and the dew forecast at the venue.
How do you handle injured players?
The probable XI uses the published squad. If a player is ruled out late, the model refreshes and a dated editor’s note is added.
Where does the recent-form data come from?
CricViz for the last-five matches and the published strike rates, with a cross-check against ESPNcricinfo before publication.
Do you predict player props?
No. The desk does not run player-prop markets. We publish the captain matrix and the role-balance checklist instead.
Do you publish a confidence interval?
Yes — it’s the small number under the headline probability. A 60% probability with a plus-or-minus 8 confidence interval means the desk is genuinely uncertain about who wins.
Can I see the verification record?
Every published prediction is archived on the verification page with the final result and the model error. The desk publishes the record every month.
The app pushes a captain pick to your phone before the coin goes up.
Get the prediction, the pitch read and the captain matrix in one mobile shell — editorial-grade, with the model error published honestly.
Where the prediction desk has been wrong, and where it has been right.
The prediction desk publishes a monthly calibration report. The report shows where the model has been wrong (predicted a side to win but the side lost), where the model has been right (predicted correctly), and where the confidence interval didn’t capture the result. The report is published on the methodology page, with the per-fixture breakdown and the calibration curve.
The desk’s model is calibrated to a Brier score of around 0.20–0.22 across the past three seasons — meaning the average prediction error is roughly the same as a coin flip with a small edge toward the favourite. A Brier score of 0.0 is a perfect prediction; a Brier score of 0.5 is the worst possible; the desk’s calibration puts the model in the “useful but not definitive” band.
The model has been wrong most often when the captain made a bowling-rotation change that the model didn’t predict. The captain’s tactical template is the signal with the largest residual variance after the model runs — because captains change their template for reasons the model can’t fully capture (an injury niggle, a tactical hunch, an out-of-form bowler who gets a death-overs reprieve).
The model has been right most often on the duckworth-lewis-stern cases — matches shortened by rain. The model can predict a rain-shortened chase better than the consensus can, because the model uses the dew forecast and the historical record at the venue more accurately than the consensus does.
The format-specific edges the desk has measured.
The prediction desk has identified three format-specific edges where the model’s calibration is meaningfully better than the consensus. The first is the rain-shortened ODI — the model uses the dew forecast and the historical record at the venue to call the adjusted par score more accurately than the consensus does. The second is the day-night Test — the model captures the captain’s known preference for batting first in pink-ball Tests. The third is the late-evening T20 — the model predicts the death-overs scoring rate within 4 points of accuracy across a season.
These edges are what the model is published for. Where the model edges the consensus by five or more percentage points, the prediction is published with the reasoning. Where the model is within three points of the consensus, the desk publishes the model’s number with the standard confidence interval.
Three lines the desk holds.
The prediction desk holds three editorial lines. The first is: no binary win-or-lose calls. The desk publishes a probability, not a verdict. A 60% probability is not a verdict that team A wins; it’s a probability that team A wins six matches out of ten with the same conditions.
The second line is: no player props. The desk does not publish player-prop markets (a player to score 50+ runs, a player to take 3+ wickets, etc.). Player props are published by the operators; the desk publishes the methodology behind the captain matrix instead.
The third line is: no published prediction where the signal-to-noise ratio is too low. The desk publishes a “factors to watch” note in place of a prediction when the model is below its own confidence threshold. The note explains what the desk is watching, what the signals are, and when the desk will publish a probability.